As the world has shifted towards online shopping, the way that we manage and optimize our business has to evolve as well. Google Analytics is a free tool from Google that's going to let you install a little bit of JavaScript on your site and it's going to unearth a treasure trove of information about your visitors. It monitors each visit and it sends that data back to Google where it's processed and put into graphs and other visualizations that allow you to see exactly who's coming to your site and what they're doing.
I'll show you how you can query this collection of customer knowledge to find patterns and insights that we might otherwise never notice. In fact, we can use the power of Google's machine learning to surface the type of insights that a computer can do far more effectively than a human ever could by sifting through millions of individual interactions.
So, what do we mean by "Digital Analytics?" Well, analytics is all about measuring your business goals, understanding your performance and finding ways to optimize and improve that performance. And the critical part here is the continuous improvement. After all, we're not here to just look at pretty pie charts for the sake of fancy reports. We want to actually do something about it. So digital analytics is also a process. We first perform the measurement, for we can't manage what we can't measure. And then we apply the analysis. We learn from what we see, and then we take action. Now, before we jump right into the Google Analytics Tool, it's important that we first go over some key definitions. As I firmly believe that knowing the vocabulary is half the battle of learning any new subject. Understanding these concepts is going to give you a headstart in knowing how to manipulate and interpret the data available, not just in Google Analytics, but really any analytics tool.
So the first two concepts you're going to be coming across in GA4 are metrics and dimensions. These two variables make up all of the data populated in the analytics reports. Metrics are the quantitative numbers that are measuring data and counts, ratios, percentages and so on, while dimensions are the qualitative categories that describe the data in segments or breakouts. You will also be looking into events, as marketers, we may think of events as things you attend. A webinar or a product launch. That's not at all we're talking about here. Here an event just refers to any one interaction. For example, if you click on a link, you scroll a page you zoom into a product, or even if you just load a page, those are all types of events. It can also be more complex interactions like completing an e-commerce transaction or submitting a form, or even when our site has an error and something goes wrong, called an exception.
Google Analytics 4 (GA4) vs Universal Analytics (GA3)
Google Analytics 4 is the new, completely from the ground up rewrite of the world's most popular digital analytics package. Years in the making, there is a completely new data model, a new interface, and a ton of new functionality. Changes include:
- Completely event driven
- Automatic tracking with enhanced measurement
- Cross device tracking
- Sessions more robust
- Vastly improved funnels and pathing
- Time-based analysis
- Additional and more flexible conversion goals
- Export all data to the cloud via BigQuery
Creating a Google Analytics 4 Account
Step 1: Log in to Google account and go to https://analytics.google.com/analytics/
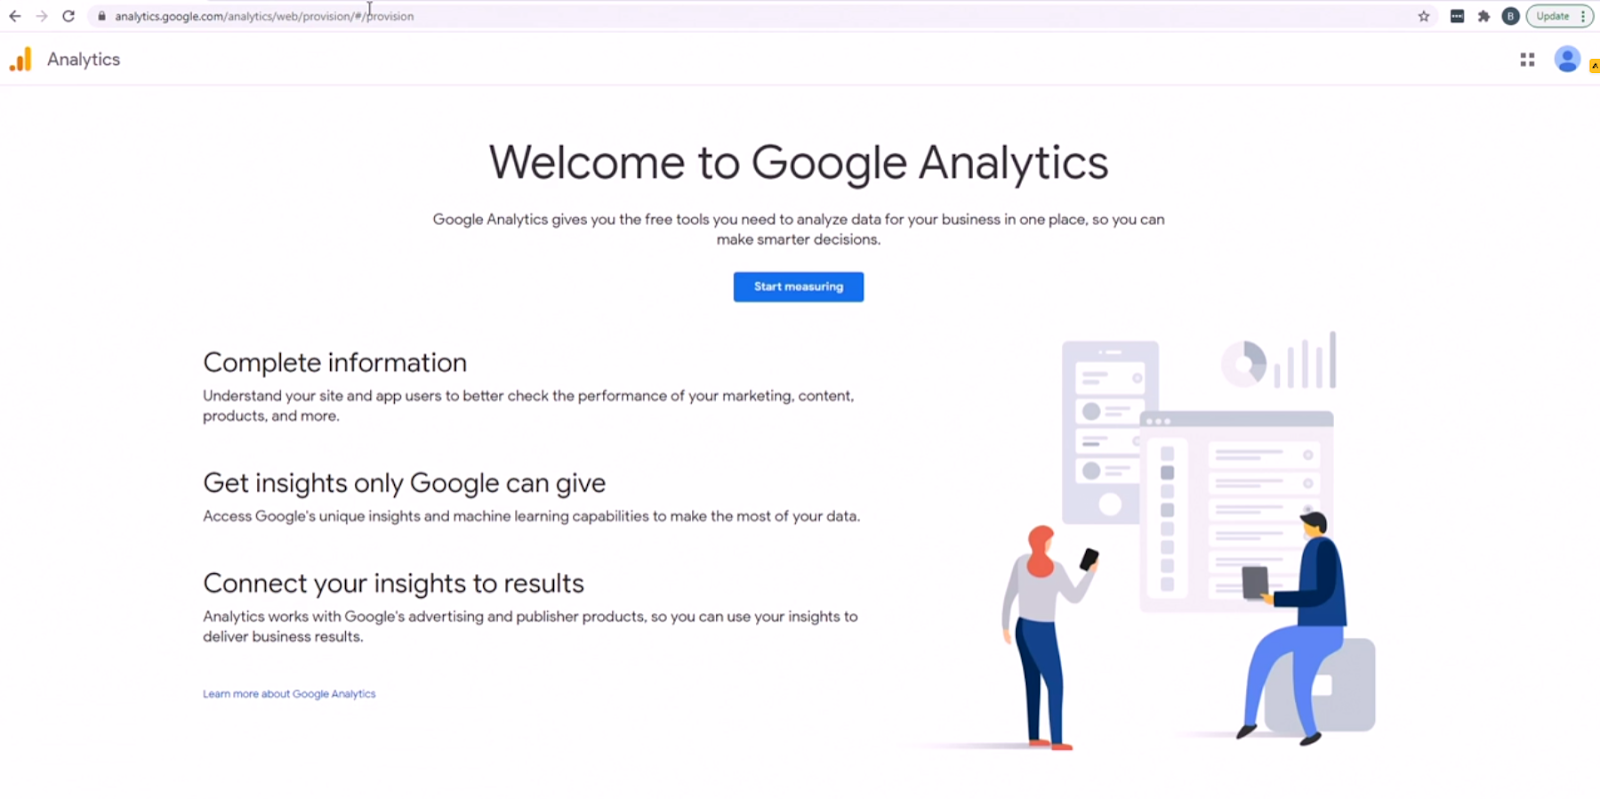
Step 2: Click on “Start measuring” button
Step 3: Provide the name of your account, your company name will do
Step 4: Provide a property name, and configure your reporting time zone and currency of choice
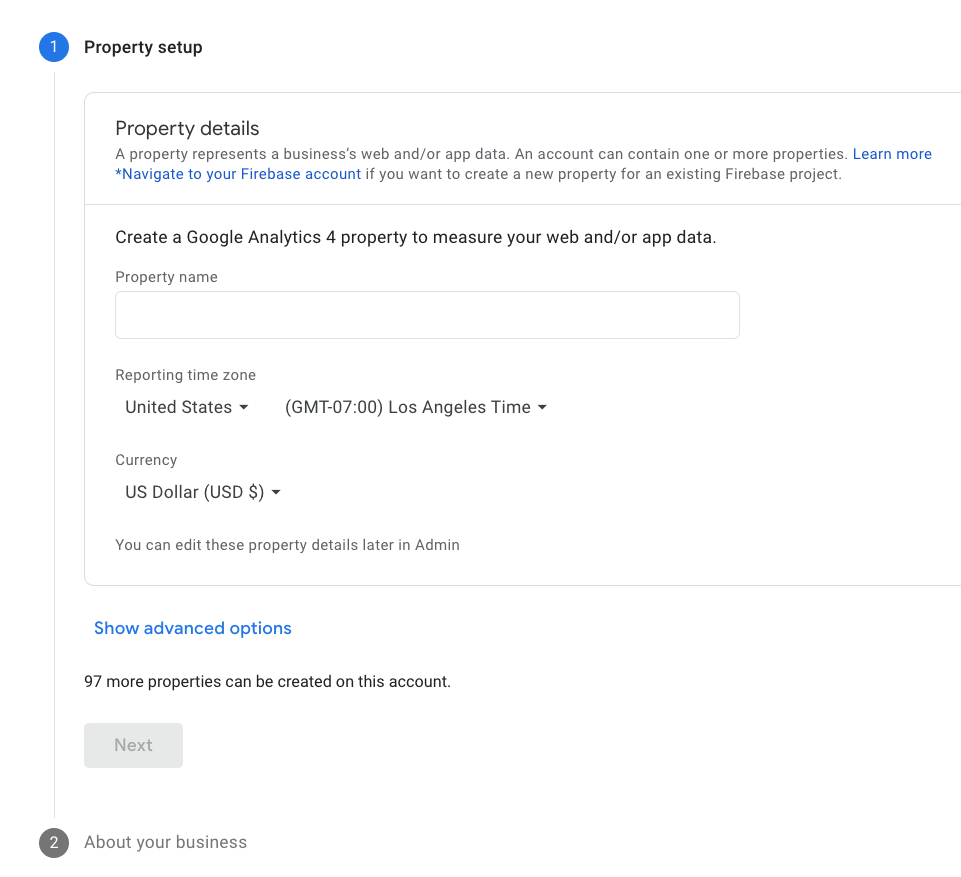
Step 5: Fill in your business details
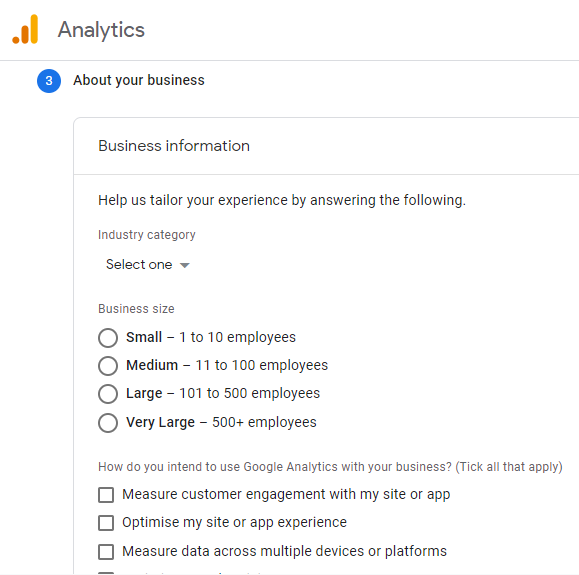
Step 6: Accept Google’s terms and conditions
Step 7: Enable enhanced measurement in your new web stream
Step 8: Under Tagging instructions, copy your site tag code (gtag.js) and paste it into your website’s header section or copy your measurement ID and use it in a tag management system like Google tag manager (GTM).
Congratulations, your Google Analytics 4 account has been created!
Campaign Tracking
Measuring how and where traffic is coming from to our site is one of the most important things we can measure in analytics. Campaign reports are one of the most useful and important concepts in Google Analytics. When you add these campaigns to the mix, you can track different marketing initiatives by source, medium and the campaign name.
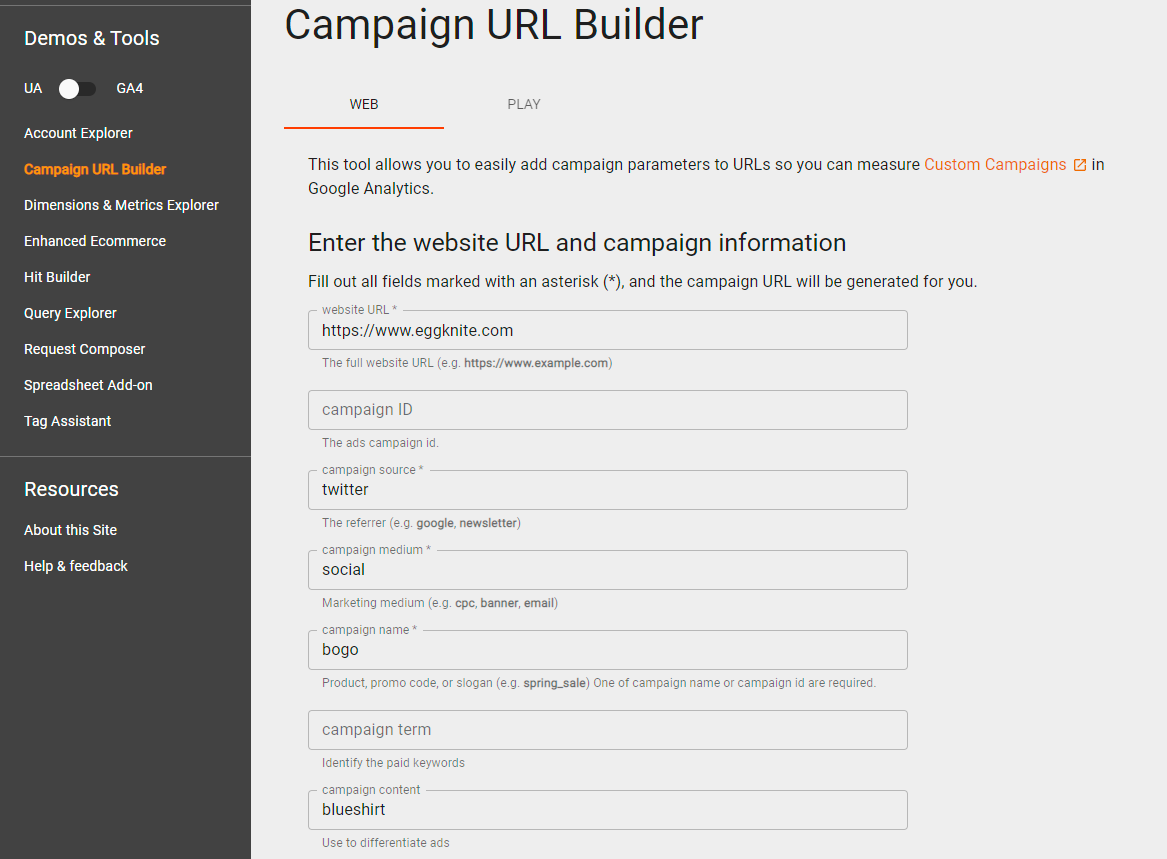
Lets say you have a twitter campaign running as a bogo promotion for a blue t-shirt, we can track this campaign using what we call UTM parameters. This is going to be a regular URL and we're just going to stuff some extra information, we can insert these UTM parameters into that URL. Google has a special tool to help us do this and make sure the format is right, to do this you can just head on over here to Google and type in Google Analytics URL builder. It'll take us right there. Once there, the first thing you want to do is put in our website and we actually have to type in the https, the next thing we want to do is put in our source. So we set our source, it's Twitter, medium is social, our campaign name was buy one get one free. Now we can also put in content, so this is often used to differentiate the creative view, for example we use the blue T-shirt. So once we're done and it's generated a URL for us, go ahead and copy that URL.. Now when someone clicks on this link it will open up the site and you just see it's just going to be the regular page here. So the page we put in, in this case, which is just the homepage and these extra URL parameters here, they don't do anything to change the site itself but they're telling the underlying analytics how to track these. The source should be Twitter. The medium should be social. The campaign should be buy one get one free and the content is the blue T-shirt. So that's all going to be sent back to Google as part of this traffic source recording.
If we do this for all of the links that we generate and put out in our tweets and our social media posts or emails that we send, we will categorize how this is seen to Google Analytics, and we'll get much better data which results in better analysis. I can't stress the importance of campaign tagging, by tagging these campaigns consistently, we make it very easy to come back, analyze and understand which of these campaigns are being clicked on, which ones are working, and which ones are not.
Interface - First Impression
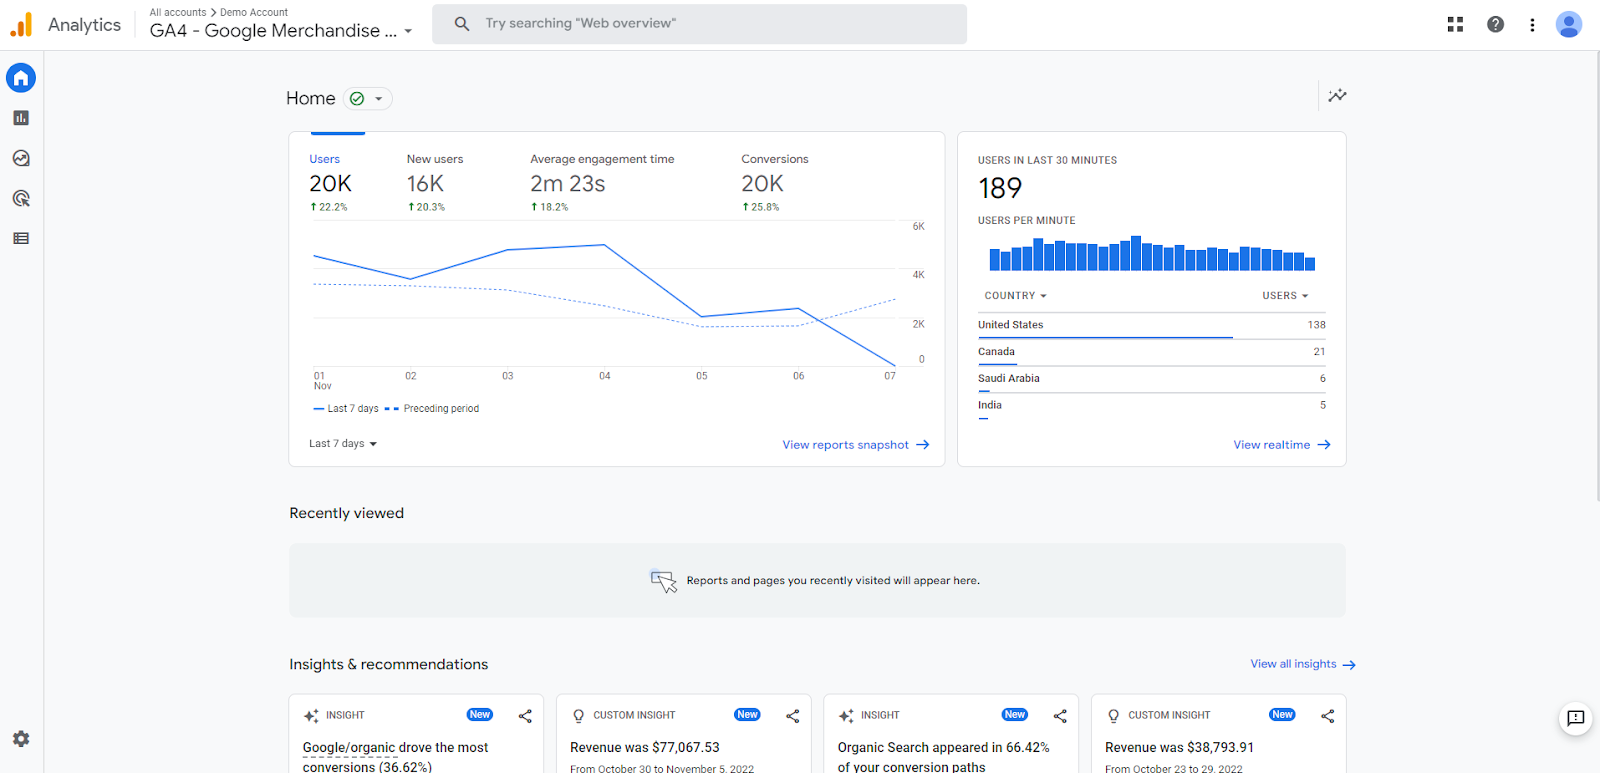
Now that you have set up your account and logged in, you can immediately notice a few different changes from the old universal analytics dashboard.
- Insights Report - We as humans can only do so much scanning every day to find insightful things. One thing Google has plenty of is both cloud compute power and machine learning and AI expertise. And we get a little taste of that here in the insights report.


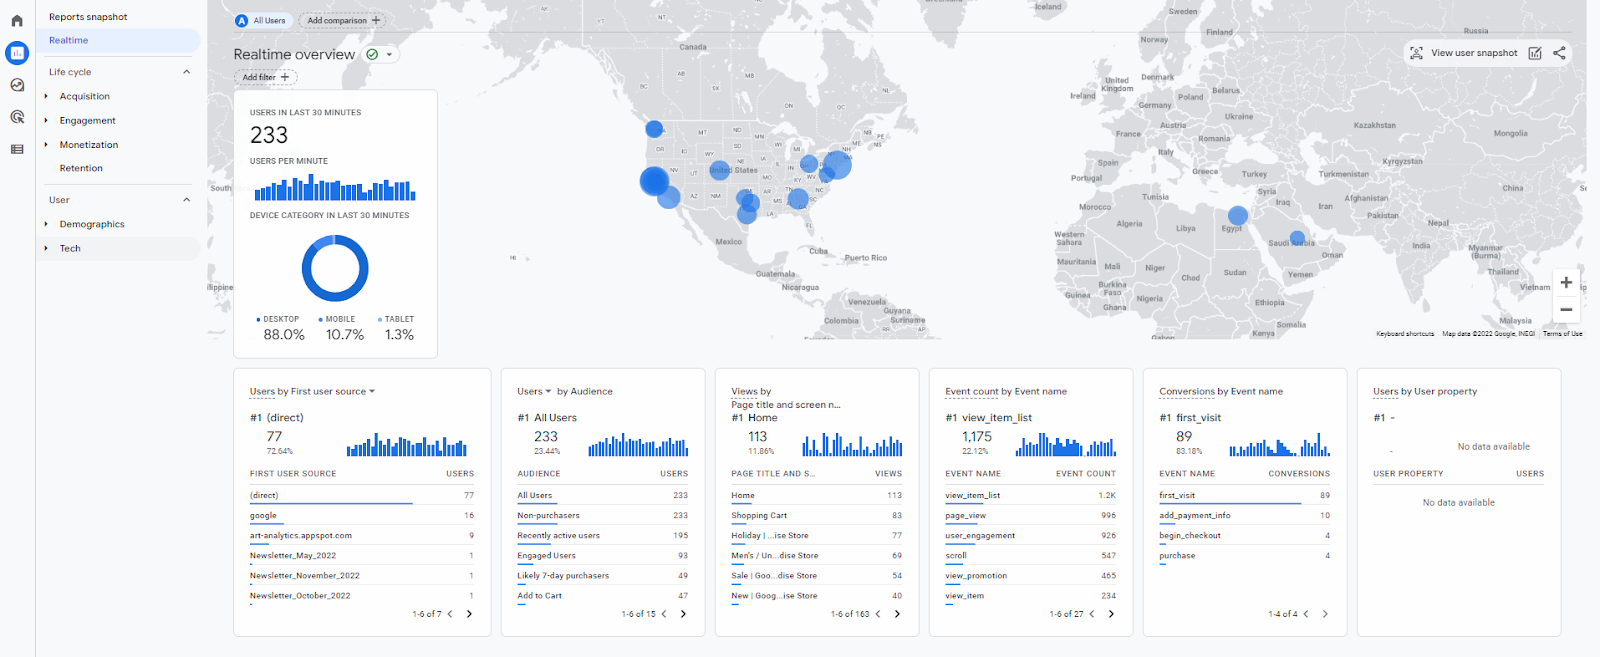
- Realtime Dashboard - We can see where our active users are in the world, what kind of devices they're using, views by source, and event counts in real time. We can even choose a random person and see what events they’re currently performing by pressing the “view user snapshot” button in the top left of the screen.
I tend to look at real time when something big is happening. So we have a big app launch or a Superbowl ad just aired and you want to see the real time reaction, and because those tend to be only occasional events you probably won't do a ton of heavy analysis here, but it's a really unique view of the customers that can't be replicated any other way.
Segmentation
Segmentation into smaller groups is the first step in true analysis and we have a lot of tools to segment users in Google analytics. I’ll walk you through lots of ways to create these segments in the various reports and analysis but the key idea here is the same in all of them. We're going to stop looking at our visitors as one big homogenous entity and instead we're going to group and cluster them by similar characteristics so we can better understand them and be better poised to take action and optimize our site for our business.
Segmentation via Comparison
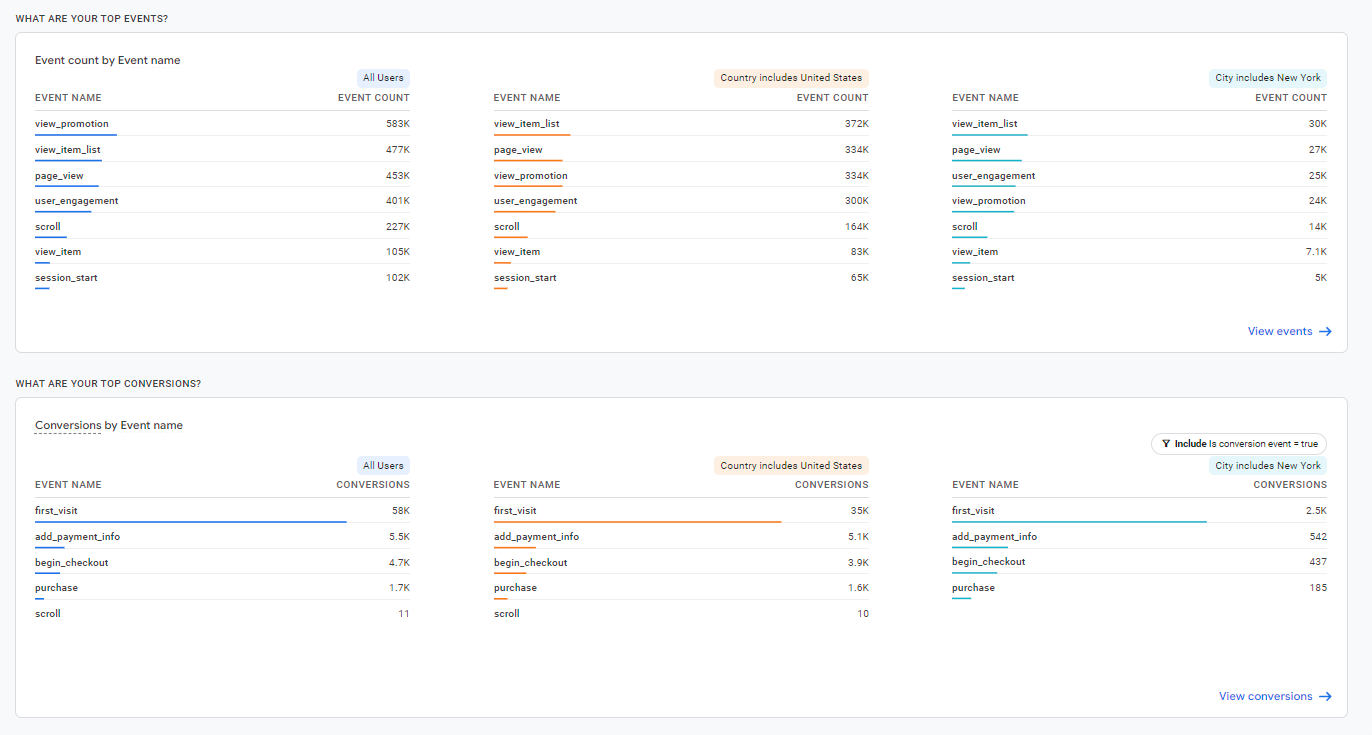
We can add comparisons by clicking “add comparison” under the reports dashboard next to the date widget. Comparisons are similar to audiences, which we'll take a look at later, but it doesn't require any additional permissions, so we can just come up here and click, Add Comparison and then it's going to give us a box where we can include or exclude various dimensions. For example, if I want to do one based on country I can include everyone from the United States into this particular comparison, and then I can apply that. And you see, we have another orange box here and that's going to give us another line on the graph which includes folks in the United States. I can also add multiple comparisons to the same report to compare them alongside each other. In the example below I included users from the United States, shown in an orange line and another comparison of users in New York represented by the blue line.
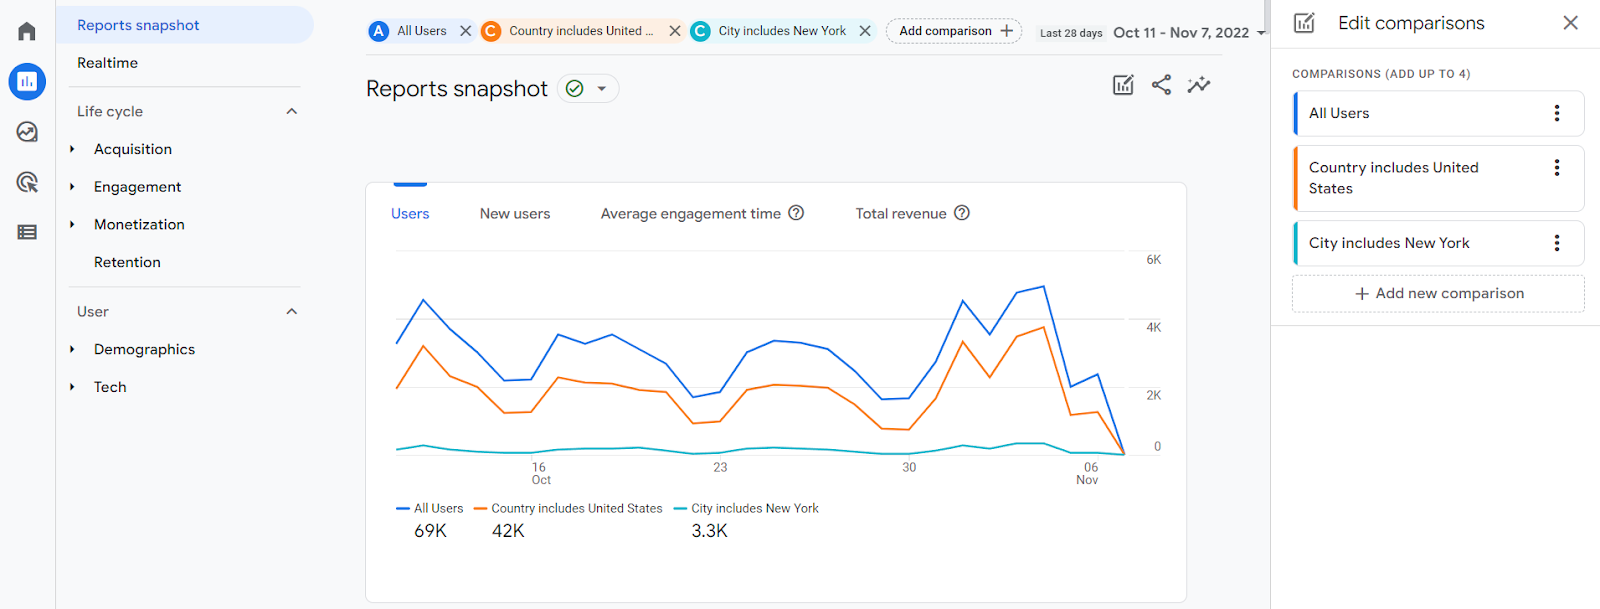
If you scroll down, you’ll see a more detailed view of your comparisons for different events such as sessions, users, activity, conversions, etc.
Filters and Secondary Dimensions
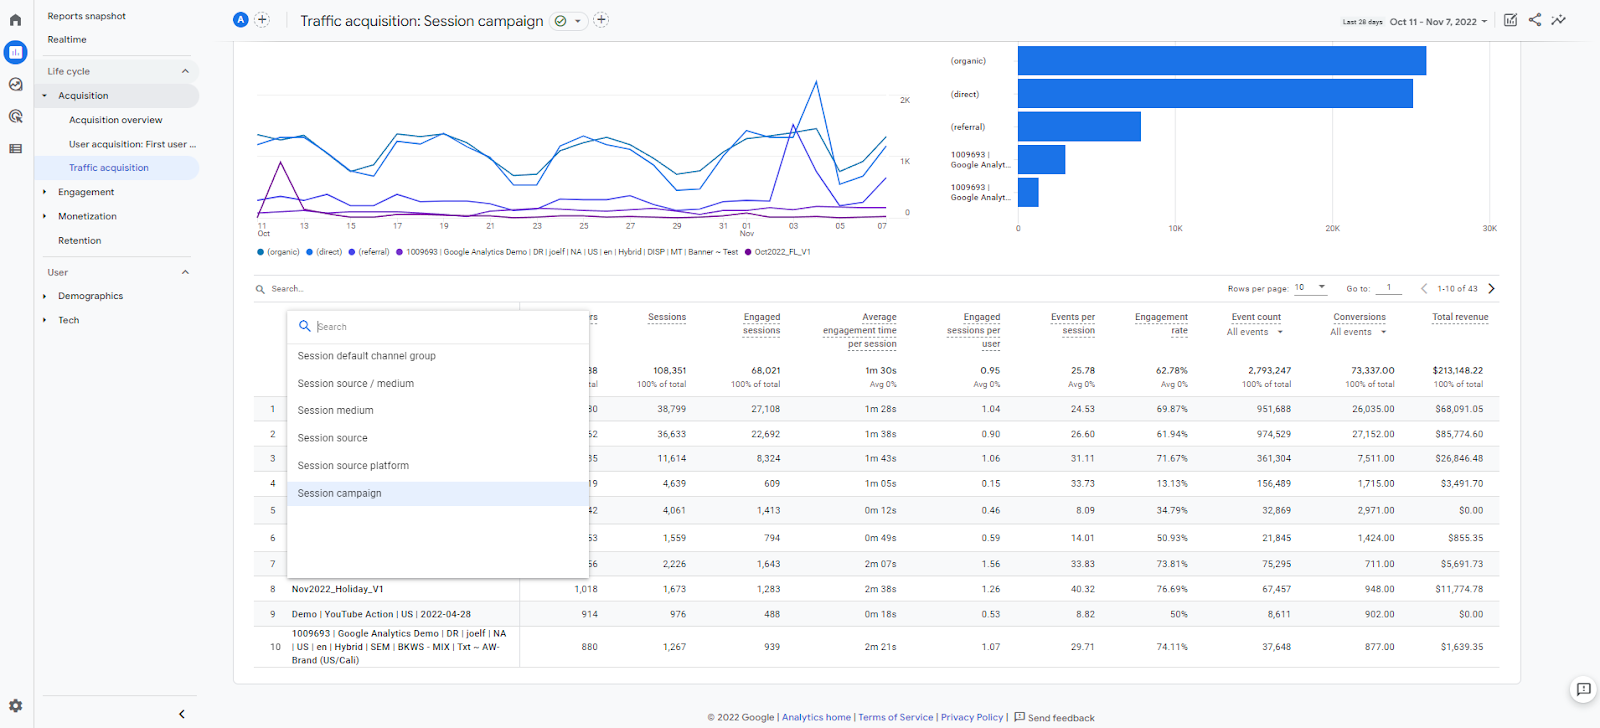
Filters and secondary dimensions can be applied to any report within GA4, for the sake of demonstration, I applied a dimension to the traffic acquisition campaign. This will show us a breakdown of all the acquisition campaigns we have running.
Audiences
Once you do your analysis and find your key segments you'd like to refer back to and perhaps engage with directly through advertising or other personalized engagement then you want to create, what we call an audience. This is kind of similar to the old advanced segments in the previous version of Google Analytics.
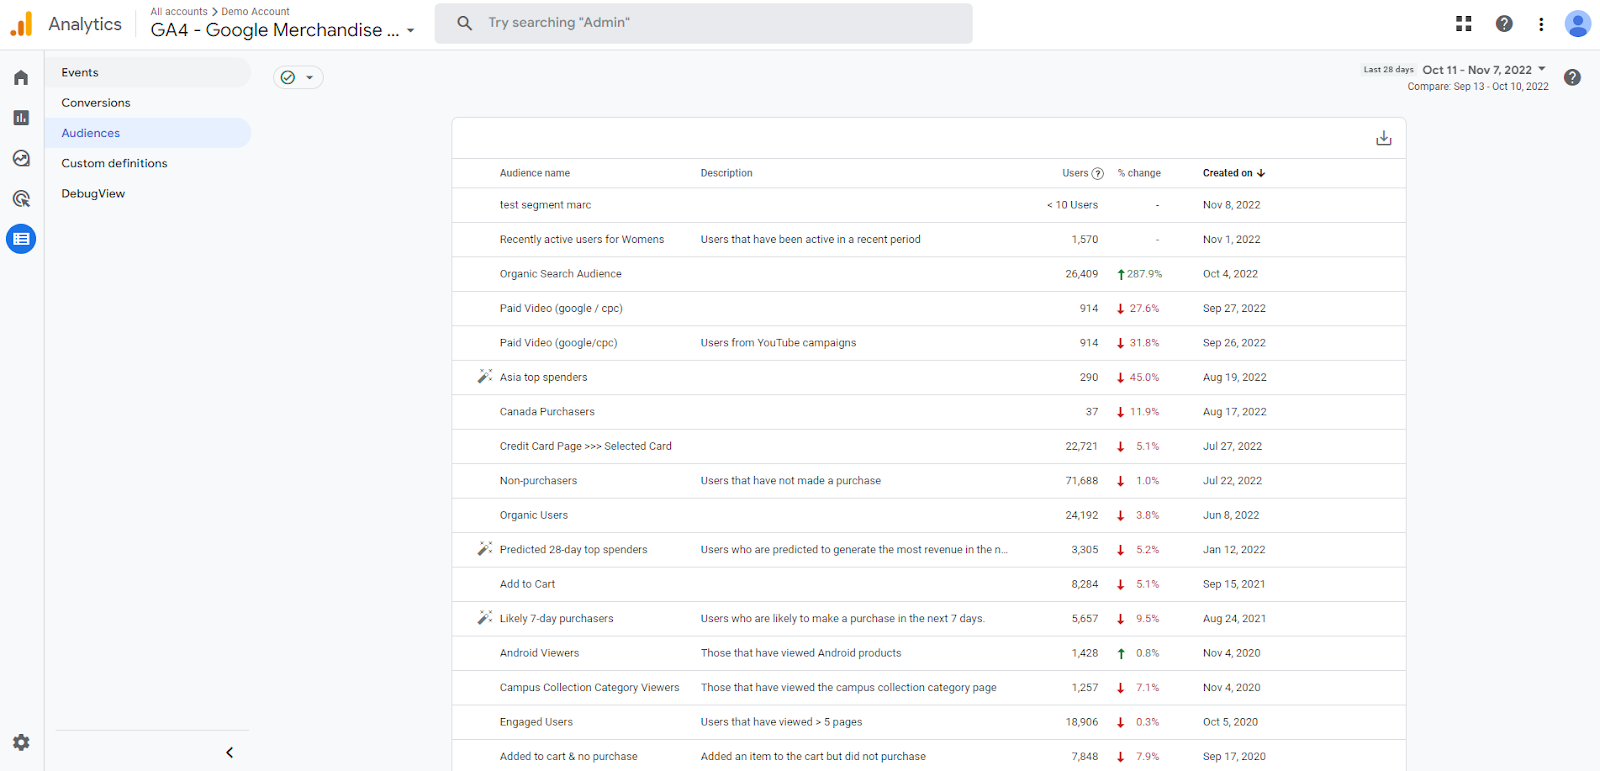
You can build audiences by going to the configure dashboard and selecting audiences. There are multiple conditions to choose from, but you can mix and match different events and dimensions to build remarketing audiences or segments you deem useful to your business.
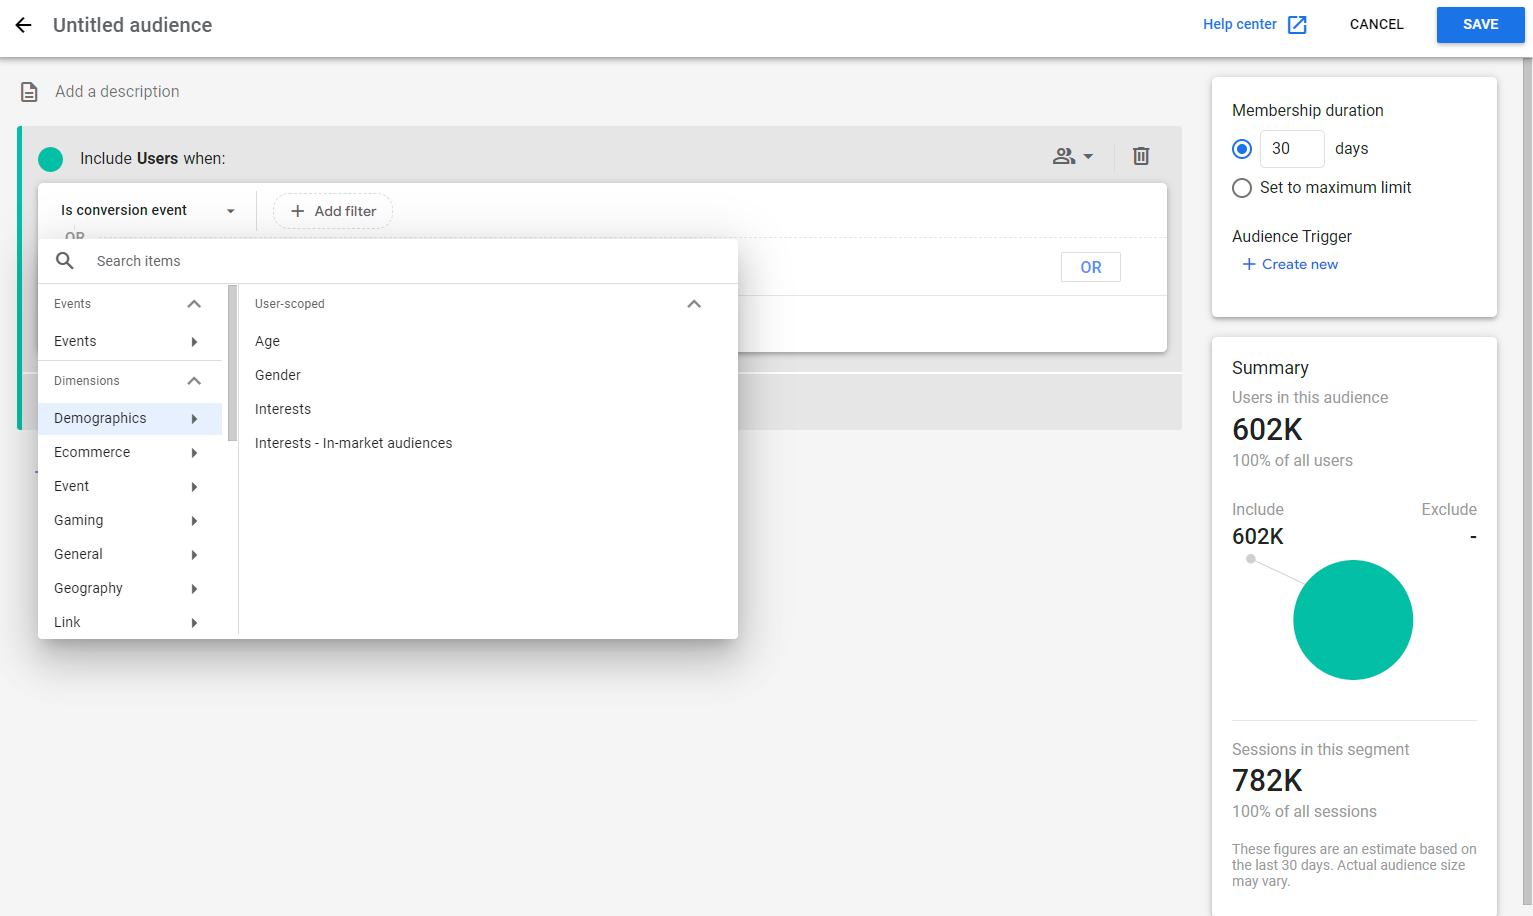
These audiences are incredibly useful for analysis but they'll also be available for marketing through the Google ads ecosystem. And since remarketing campaigns produce the highest ROI. This is a great way to build those audiences if you're interested in doing so.
Life Cycle Reports
Engagement Reports
The engagement reports dashboard starts with an overview. It shows at a glance what’s happening, we can see the average engagement time, how many sessions there were per user, and the average engagement time in each of those sessions.
Engagement Reports - Events
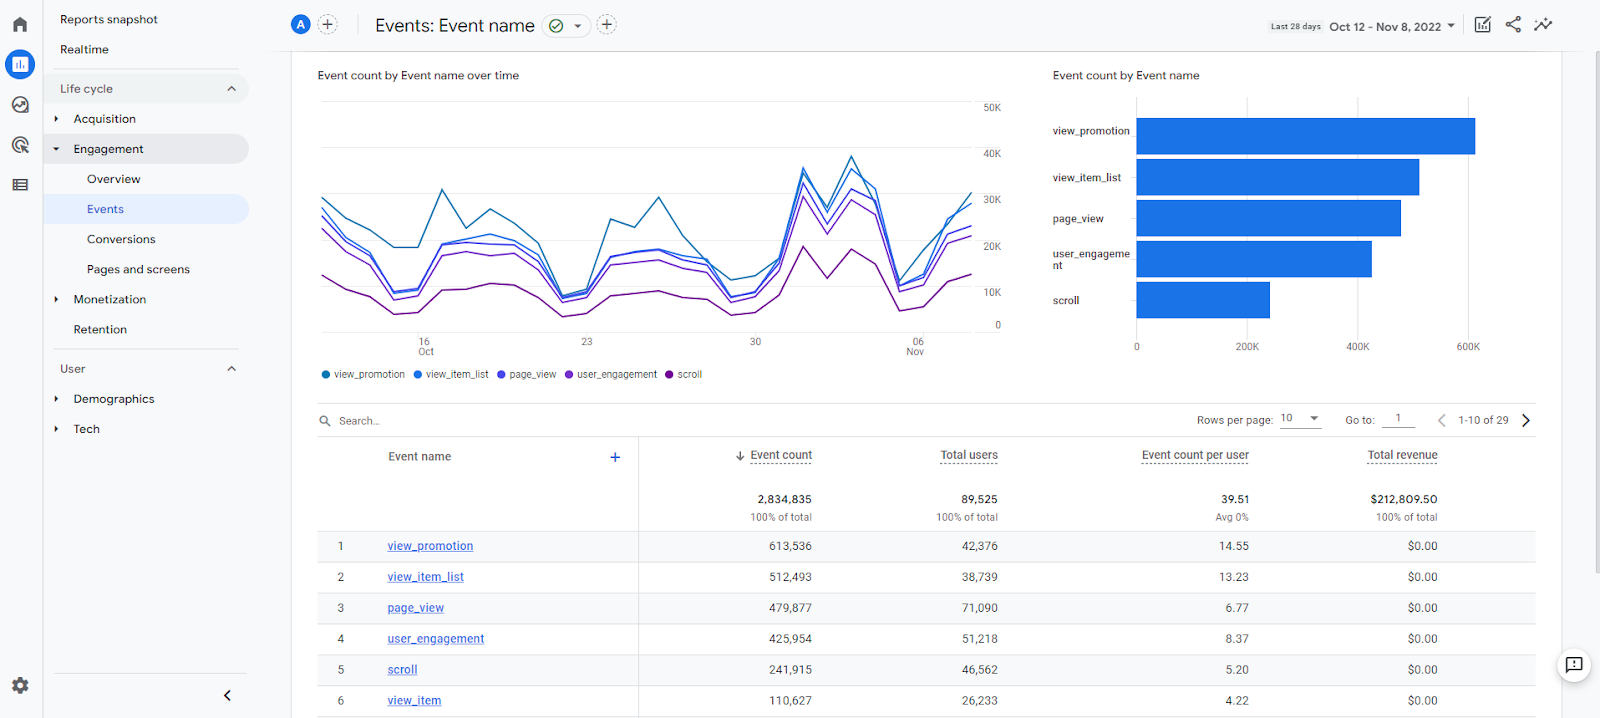
Google Analytics 4 is an event driven model, which means that everything is part of an event. Even the start of a session is just an event firing called session start. Every time a page is viewed, a page view event gets fired and inside of that event are several parameters, which each have a value, the location of the page, the title of the page, even the resolution of the screen that's viewing the page, and so on. Now Google Analytics 4 has a lot of these built in events. That's how it works. So if we head back to those reports here under the engagement and events, we can see all of these different events by name, including that session start event here.
Monetization Reports
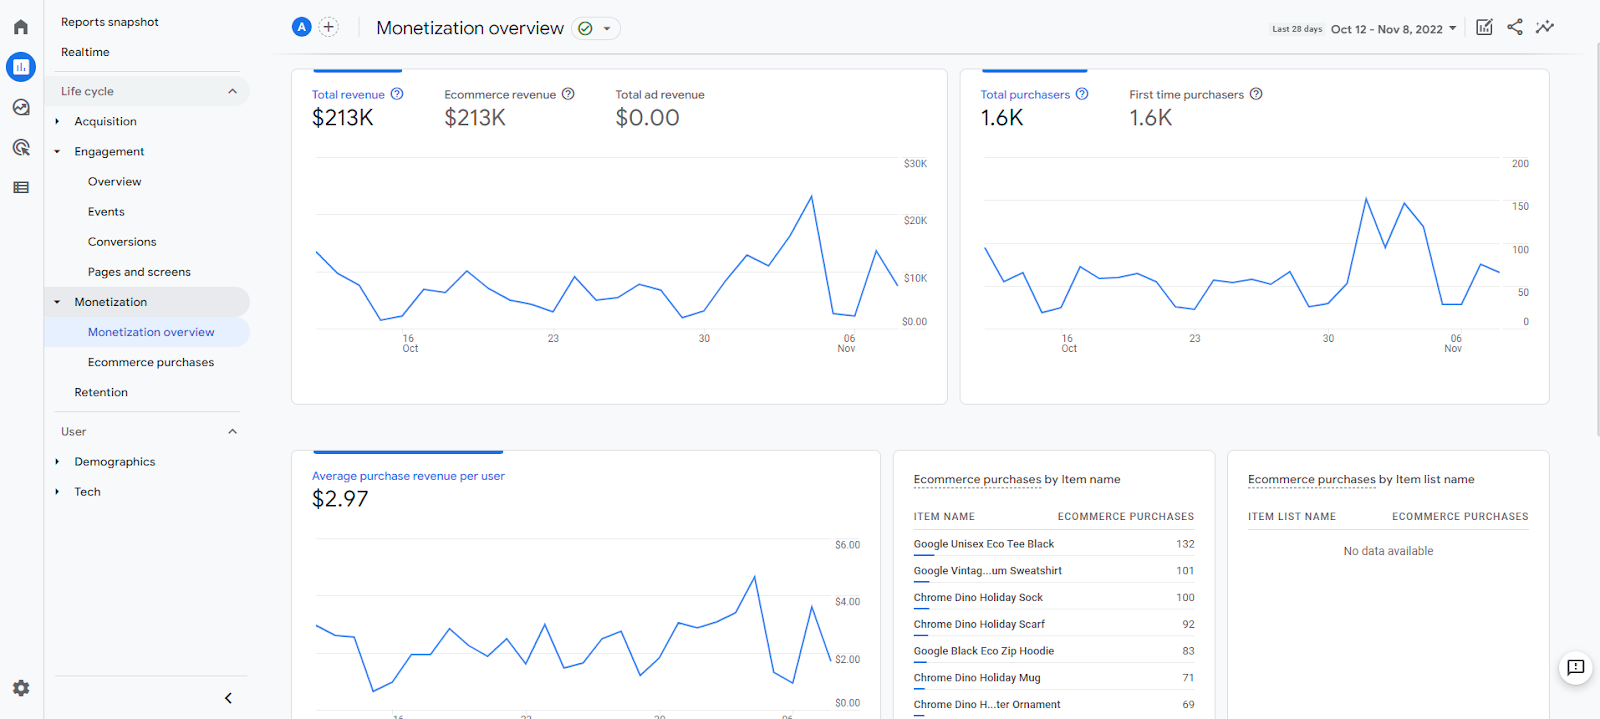
If you have an e-commerce site, you'll need to send back e-commerce hits via your shopping cart. The details of that will vary depending on your cart software. Understanding how users interact with the products and services you sell can help you optimize the shopping experience on your ecommerce website or mobile app. For example, you can measure the products your users view most frequently and how product placement, promotions, and banners impact conversions.
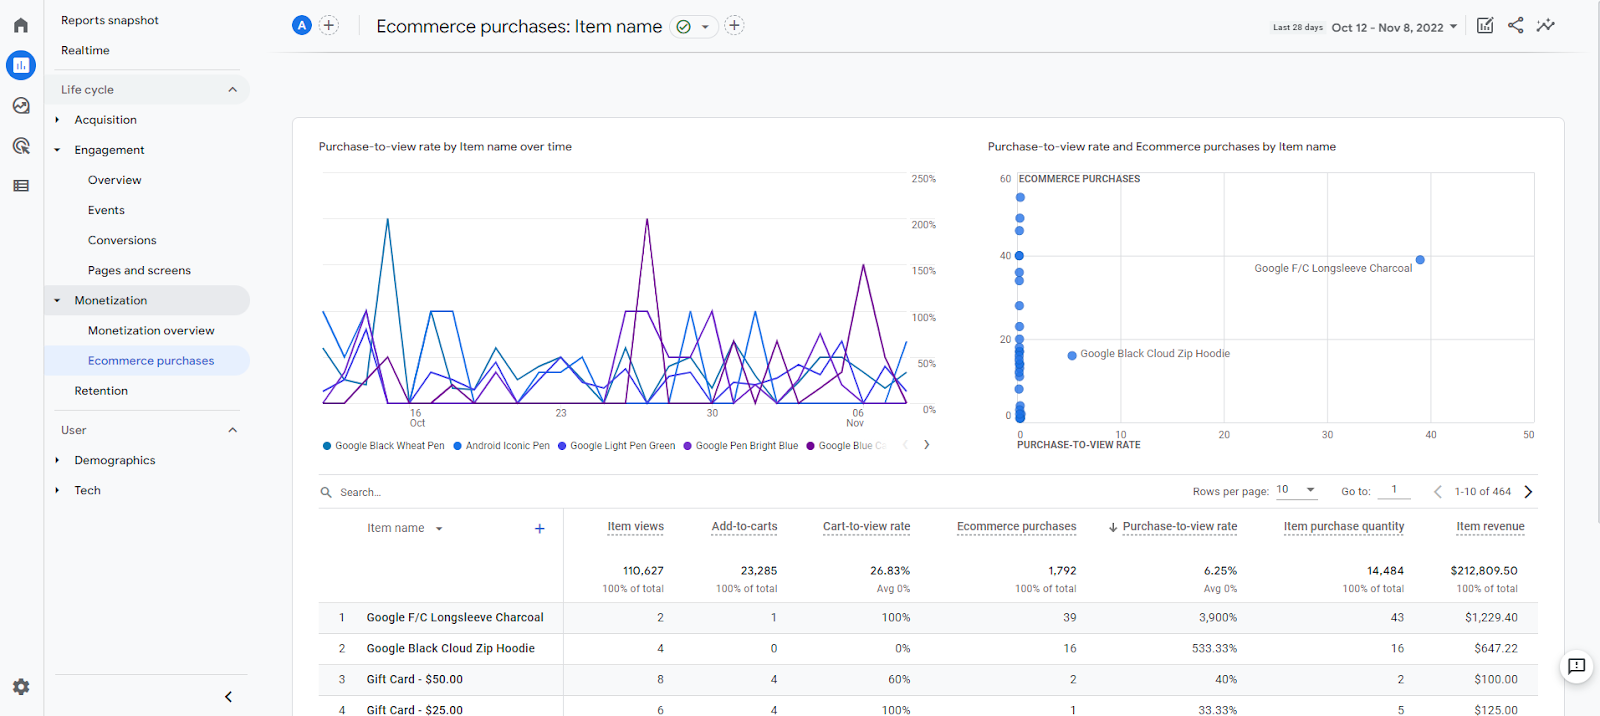
I like to sort the data by item name and then look at different metrics such as cart-to-view rate and purchase-to-view rate. The e-commerce report under monetization provides a ton of information and metrics that can give you in-depth insight into your e-commerce data.
The best way to configure e-commerce events would be to do them via Google Tag Manager. To do so you need to create a Google Analytics 4 Event tag for the event.
To create a Google Analytics 4 Event tag for the event, follow these steps:
- In Google Tag Manager, click Tags > New.
- Click Tag Configuration > Google Analytics: GA4 Event.
- In Configuration Tag, select your Google Analytics 4 Configuration tag.
- In Event Name, enter the name of the event (for example, view_item_list).
- In Event Parameters, add a row for each event-level parameter.
- Event-level parameters are parameters that you include within the event, outside of the items array, such as the item_list_id and item_list_name parameters in the view_item_list event.
- Save and publish the container.
Retention Reports
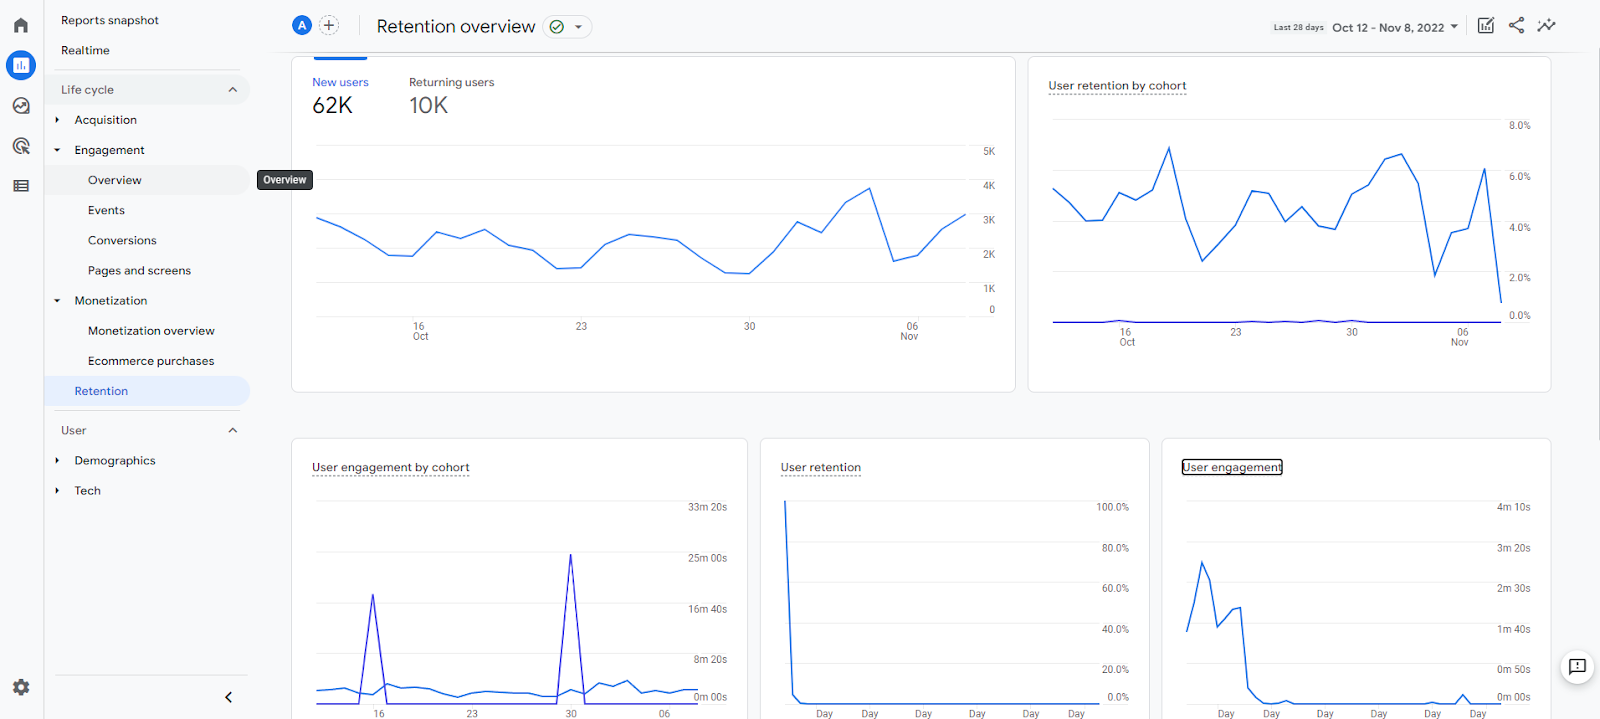
The retention report shows you an overview of user retention, engagement cohorts, and lifetime value. It's meant to help you understand how frequently and for how long users engage with your website or mobile app after their first visit, and helps you understand how valuable users are based on the additional revenue you generate after their first visit.
User Reports
Demographic Reports
We can think about our analysis of our users in terms of who they are, what they're doing, observable behavior, and what they're trying to accomplish, intent. We spend a lot of time on observed behavior in GA but in marketing analytics overall, we're often interested in demographics and we have a section dedicated to that in Google Analytics that's going to address the who, what, where, and some interests as well.
Now this is unique because it's one of the only reports where extra data is brought in to supplement your reports and it's not generated by your site or your app. This is because Google actually already knows a lot about your visitors from their own internal analytics, especially those that have accounts with logins like Gmail, Android, Chrome, YouTube, Google Meet, Google Docs, and so on. Now for that reason, Google is particularly well suited to provide you with some extra background information on your users. From a privacy point of view, of course, all of this data is anonymized and aggregated. It's only provided if there are lots of users in the segment so no personally identifiable information is ever shared.
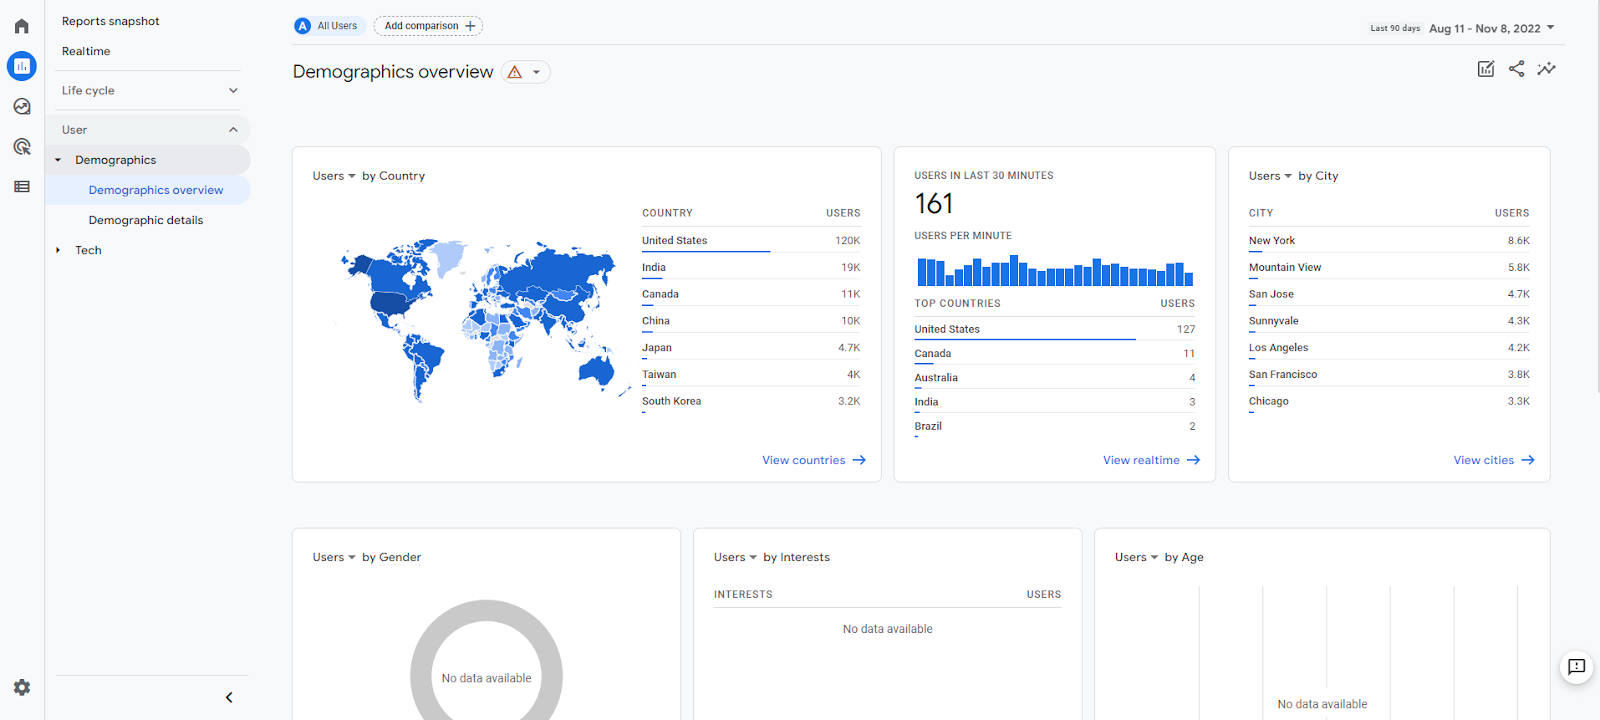
Demographic reports are broken down into two views, the overview and the detailed report. The overview will show you top level metrics such as user demographics, such as location, gender, age, and language.
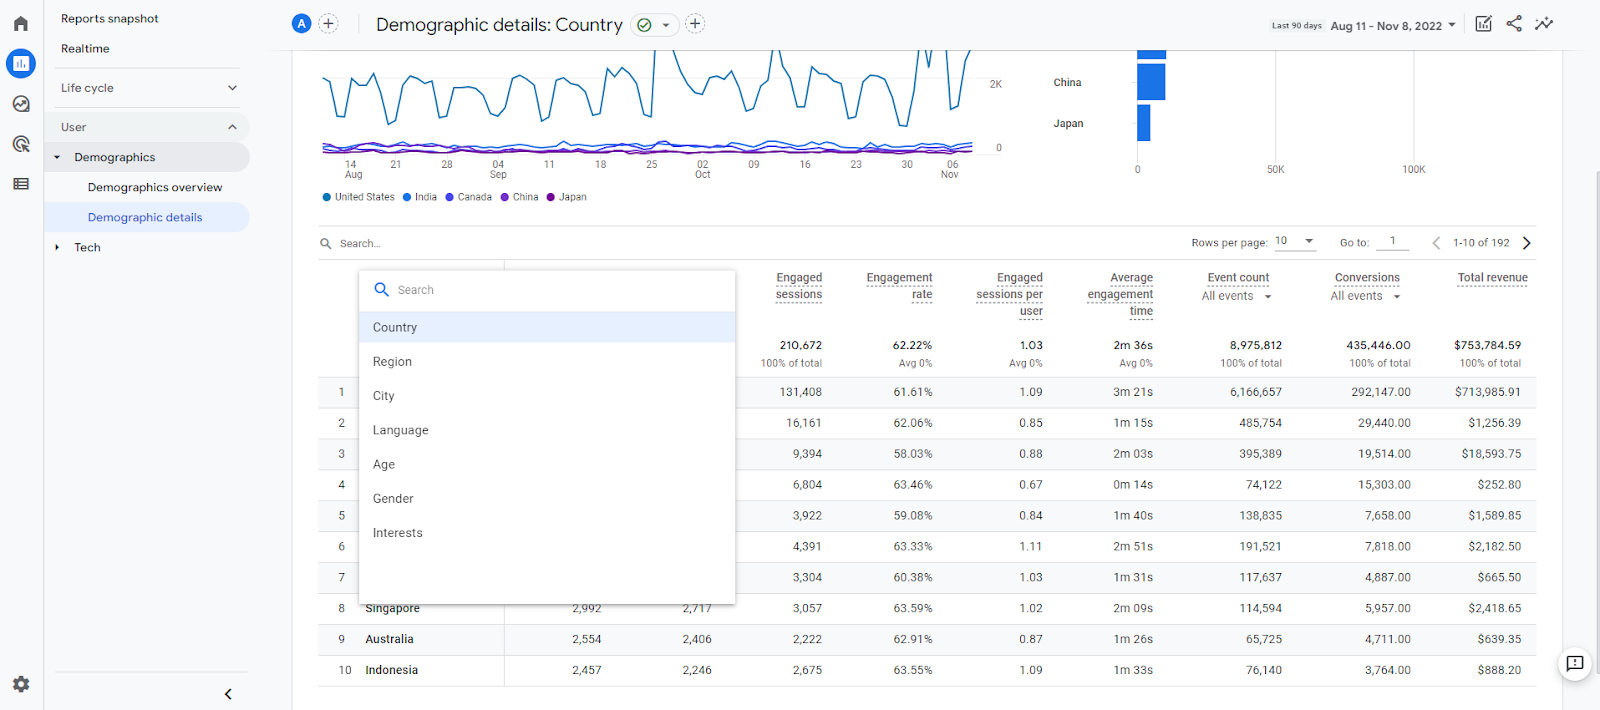
The demographic detailed report will allow you to sort by these top level metrics but at the same time filter by engagement metrics, event counts, conversions and total revenue.
This allows us to leverage Google's user graph and if we combine it with our account data, we can learn much more about our visitors than we otherwise could.
Technology Reports
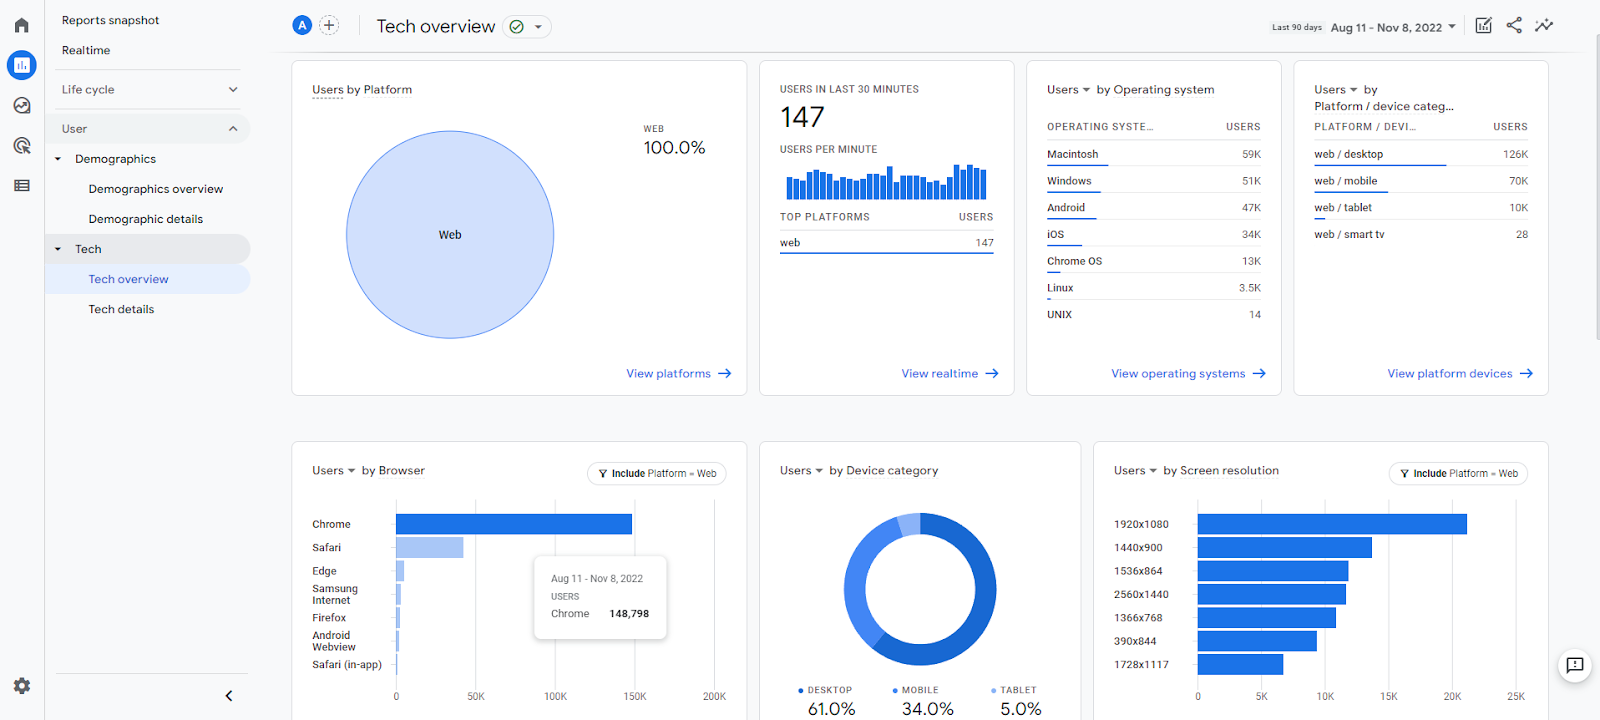
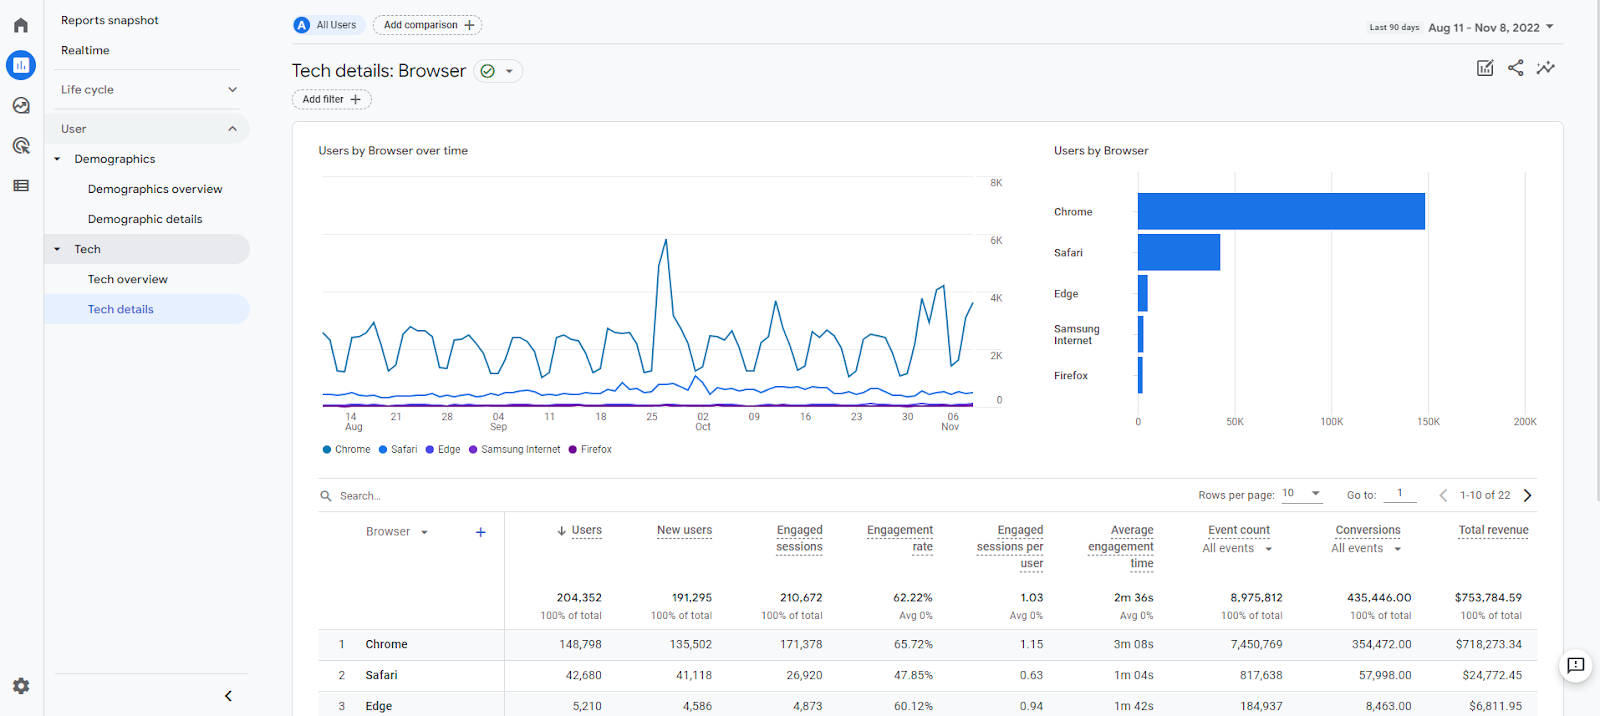
So when we go to the tech reports, we're going to see the same template as we did in demographics. We've got the overview, a breakout for each of the top level tech metrics, then the details report.
In the overview report we can break analytics down by operating system, browser and by desktop versus tablet versus mobile, and web. We can also view screen resolution, which is always interesting to think about as we think about how we design our site, just because you're at work and you've got your monster 32-inch monitor, that doesn't mean everyone around the world is viewing your site the same way.
Analysis Hub
In some ways, I feel like everything we have done up to this point is just to prepare you to be unleashed on the Analysis Hub. We mentioned earlier that Google Analytics 4 is less about the predefined standard reports, and not that the reports we've analyzed so far, haven't been useful, but they also serve to explain the various elements, the primary dimensions, the secondary dimensions, the metrics, the audiences, the filters, and so on. But once we get familiar with those things, we can go in knowing exactly the report we need to build in our head in order to answer our analysis questions. And for that, we can use the ultimate power tool, the Analysis Hub.
In the analysis hub, you want to create a new report, there are templates to choose from but I’ll be walking you through a free from blank report. On the left hand side, you have two columns, one with the variables you want to set, and the other for the data you want to show on the report. Under the first column, you can choose the segments, dimensions, and metrics you’ll be using. Once those are set, you can drag them to the active configuration column.
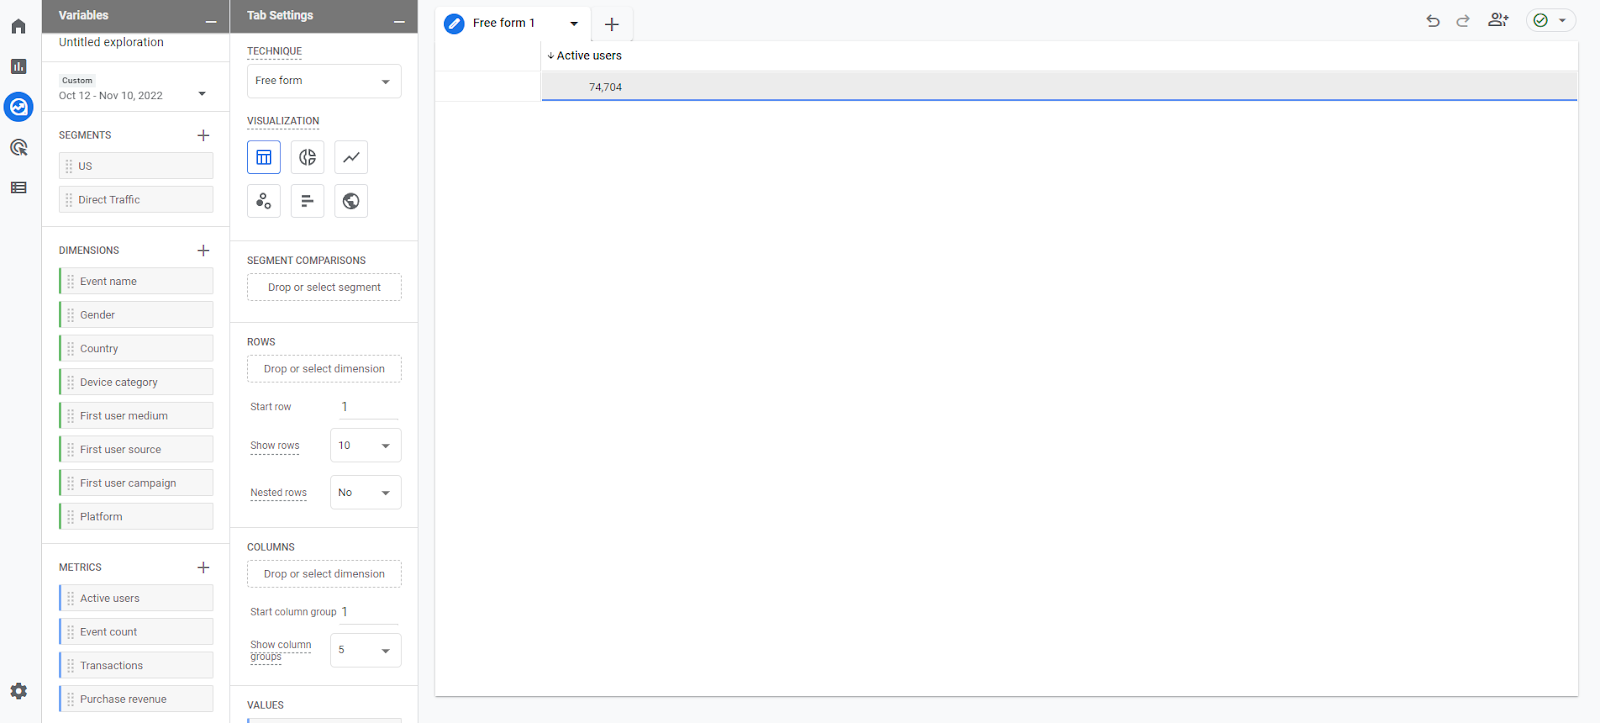
Let's say I wanted to show all the active users in the US sorted by screen resolution, I would drag my US segment and move it under segment comparisons, I can then move my screen resolution dimension under rows, and the active users metric under values.
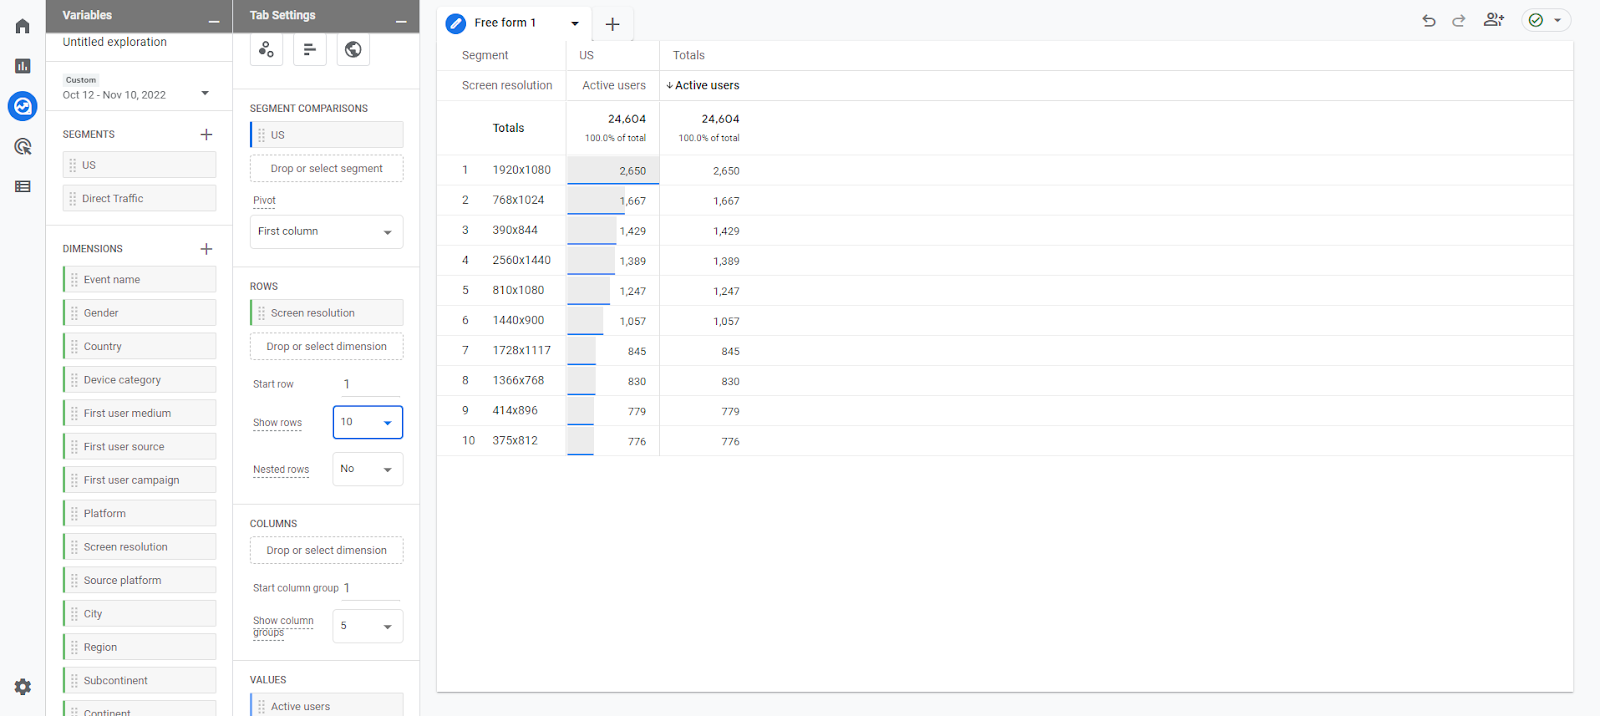
This is just one example, but hopefully it's illustrative of the power of this tool. For me, if I know there's already a predefined report, that answers exactly what I want, I will go there, but most of the time I just start here because I know that within a few clicks, I can have what I want, but I also have so much more flexibility here to modify and customize it as my analysis requires.
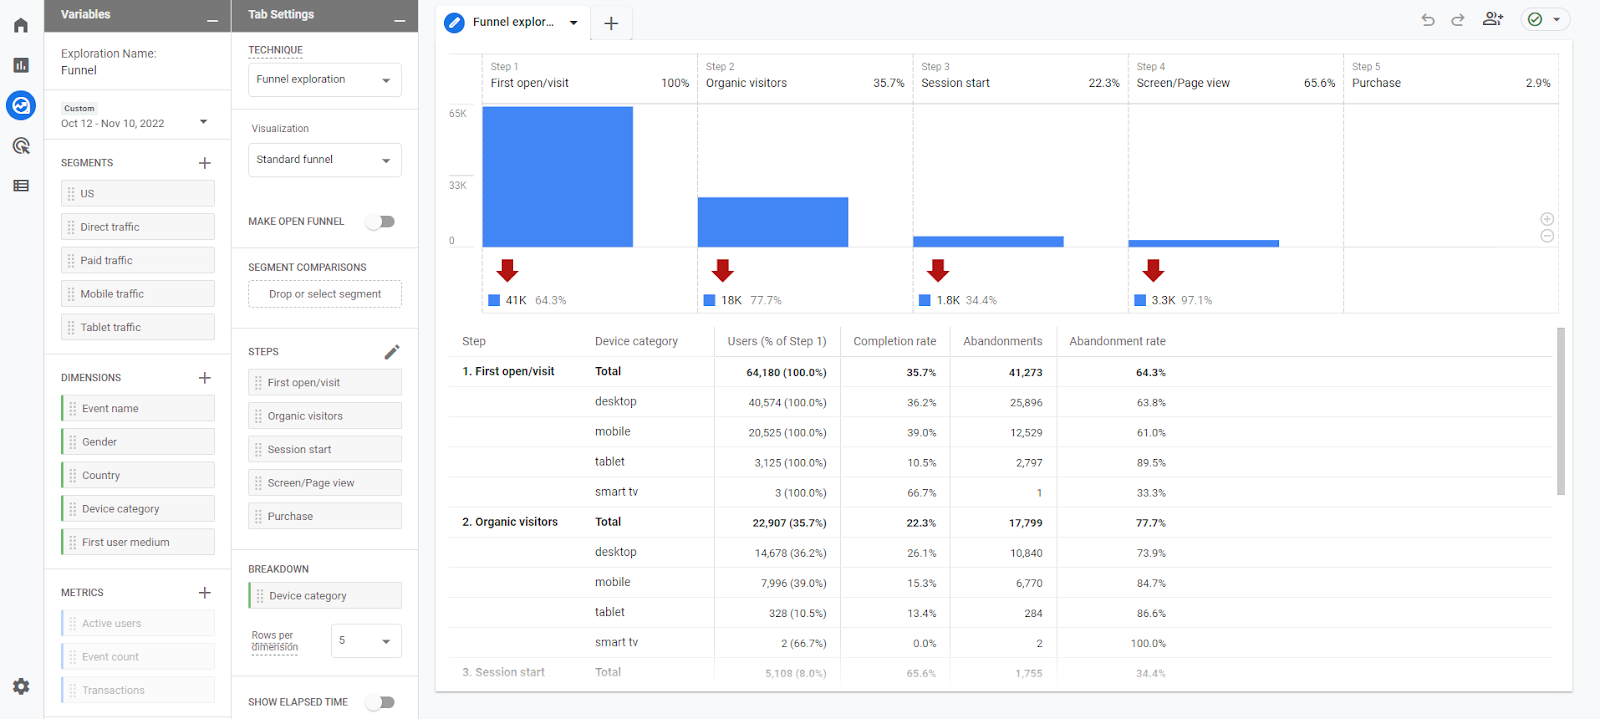
One of the most improved features of Google Analytics 4 is the funnel analysis. It is much better, previous versions of Google Analytics funnels were really inflexible. They really only worked if your site just happened to line up exactly how they were designed to work, and most of them didn't. The new version pulls in features that were previously only available in the enterprise version, and it's actually even a little bit better. So for now, for free, you are getting a better funnel analysis tool than you get in the $150,000 enterprise license. So the primary benefit here is that you can build the funnels any way you like, from page views, events, conversions, and you can do it all retroactively, before, you had to guess ahead of time what the path would be, and then build the funnel, and only then would it start collecting data, and you had to hope you'd guessed it right or all that user behavior would be lost and you'd have to start all over again.
Configuration Basics
Enhanced Measurement
Make sure you have enhanced measurement enabled. Enhanced measurement lets you measure interactions with your content by enabling events. No code changes are required. When you enable these options for a web data stream, your Google Analytics tag starts sending events right away.
To enable enhanced measurement,
- In Google Analytics, click Admin.
- Make sure you are in the correct account and property.
- In the Property column, click Data Streams > Web.
- Under Enhanced measurement, slide the switch On to enable all options.
- Click Settings to edit individual options as needed.
Goals
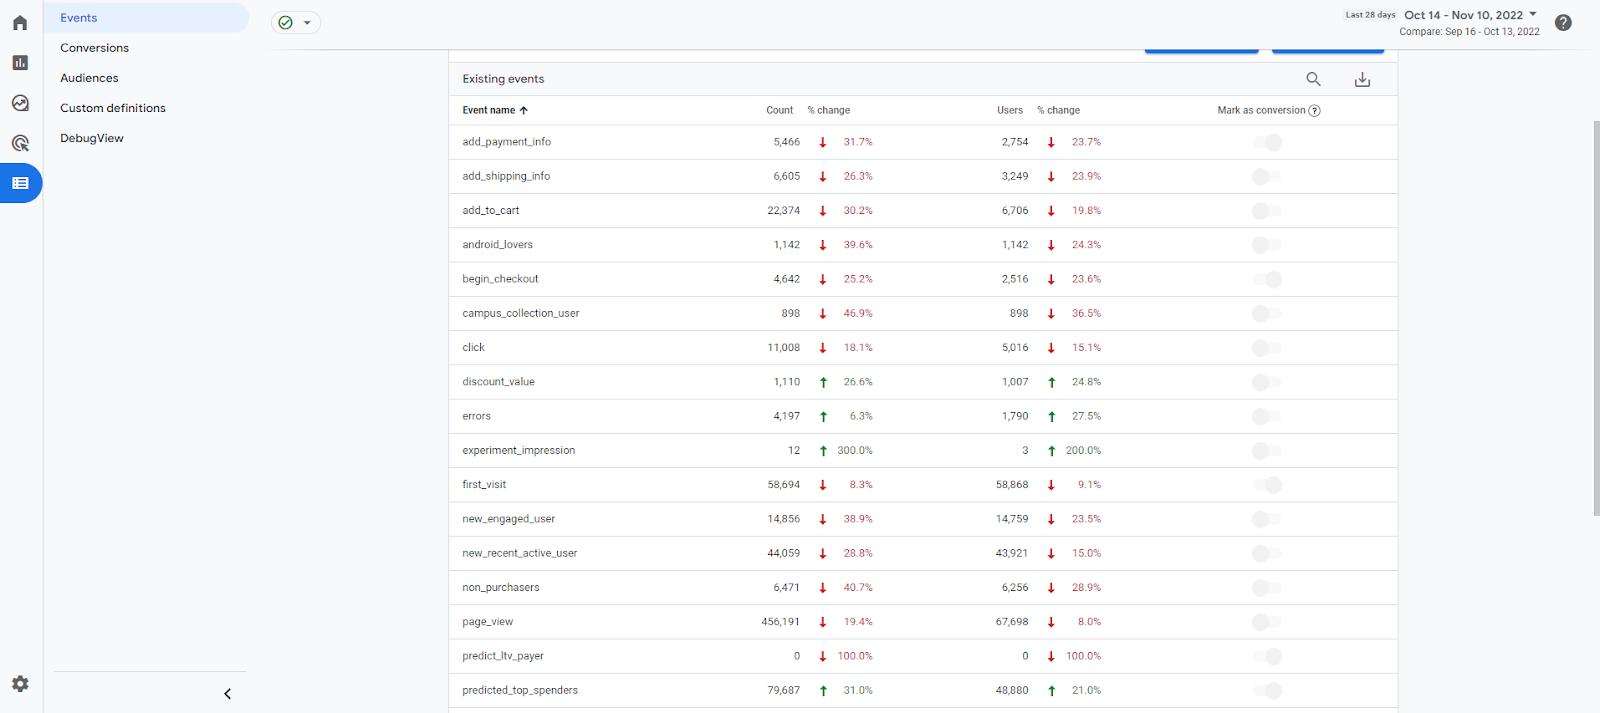
We want to be able to track not just the quantity of traffic, but the quality of traffic, that campaign I spent all that money on, it brought lots of visitors, but did they actually do anything I wanted them to do? If you want to find that incredibly valuable audience so you can do lookalike modeling, you need to have a way of evaluating what those good outcomes are and that way is either through e-commerce transactions, ad revenue, or simple goal conversions. You don't have to have an e-commerce site. You could have a form submit, you could have a downloadable white paper, whatever it is, we want to mark that as a goal conversion.
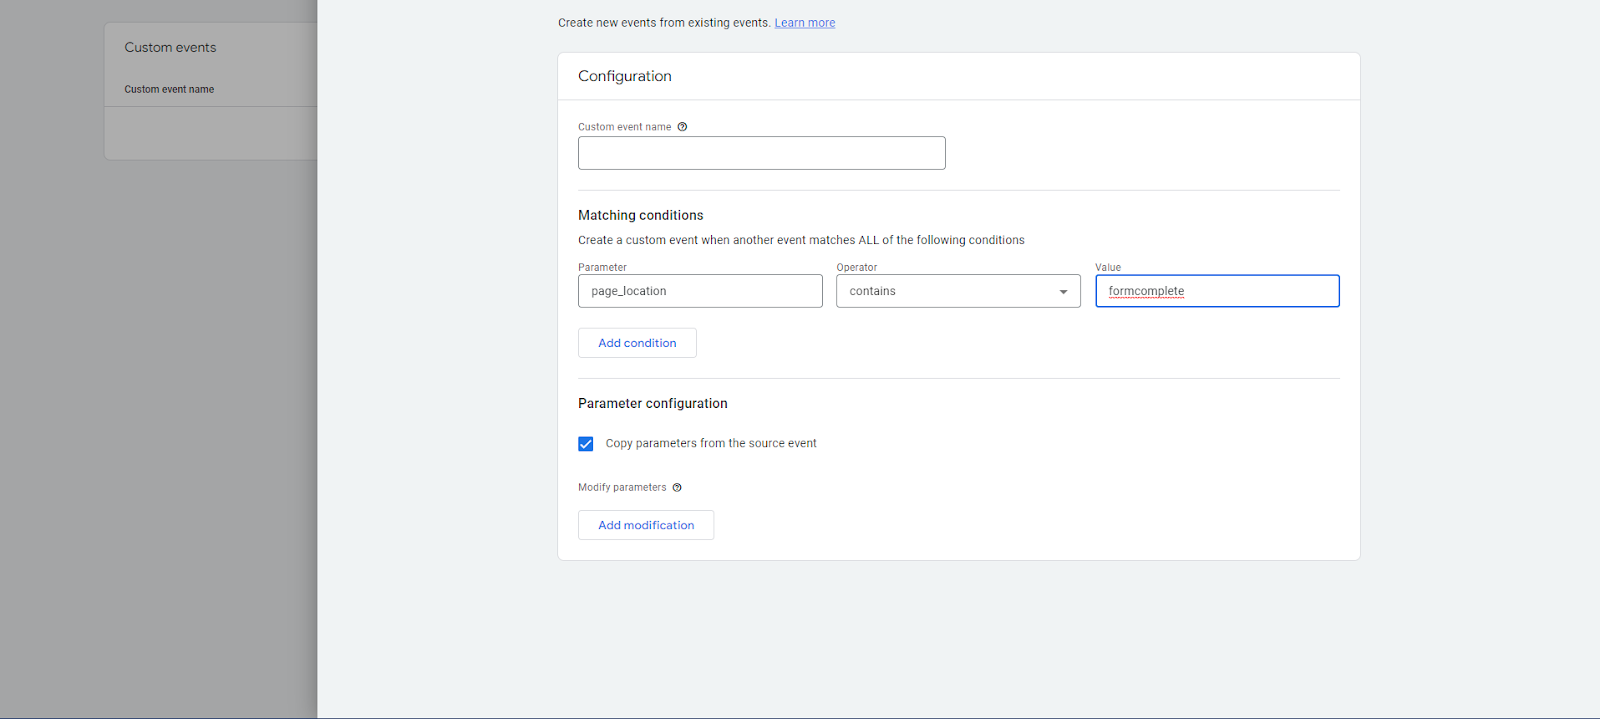
To create conversions, you first need to set up the event you want to mark as a conversion, to do so, you can head over to configure, under events, create a new event and specify the conditions for that event, the simplest way to do this is to choose page_location as the parameter.
In the screenshot below, I configure a new event for a form submission, and if the page location contains the word formcomplete in the URL, this event will fire. Note, it may take up to 24 hours for your new event to appear.
Once you’ve configured the new event you want to track, you can mark it as a conversion.
Conclusion
We've covered a lot here and I hope you not only have a solid foundation to work from but desire to learn more and continue to delve into this fascinating topic of digital marketing. Believe it or not we've just scratched the surface of what's possible. I will soon be creating a more advanced GA4 guide that will be more comprehensive along with a detailed checklist you can use to make sure your implementation is spot on.
Finally, if you want to put your knowledge to the test, Google offers a Google analytics individual qualification exam for those who'd like to demonstrate their proficiency. Now this guide is not designed to teach you that test but you will have a major leg up on your studies now that you've read this.
Thanks so much and happy analyzing.


